Can Australia make
room for a better life?
What if migration slowed, housing caught up and AI changed the way we build? A closer look at a 30-year thought experiment—and the evidence it still needs.
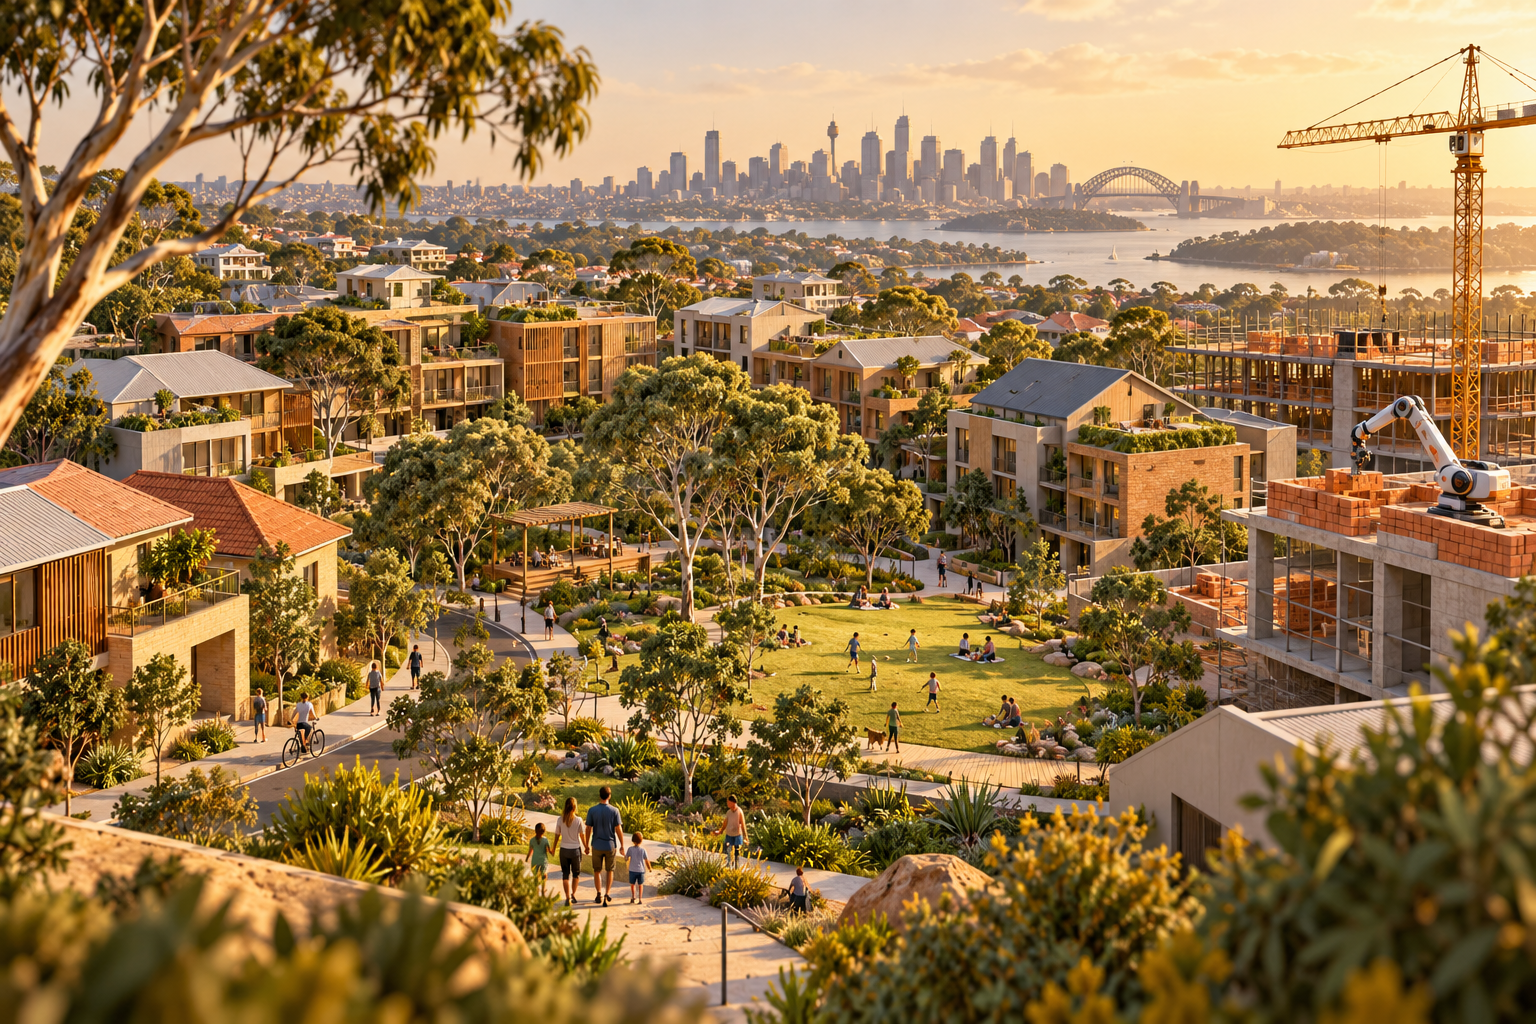
A home to live in. A future to build.
A bird builds a nest to live in, not to watch its resale value rise. For people, too, a home provides stability, belonging and somewhere to raise a family. The policy question is whether Australia can improve that security while managing population change, an ageing workforce and the costs of building.
The original NewNWS proposal asks a provocative question: what if general immigration stopped initially, essential workers entered only when local training and automation could not fill gaps, and housing policy focused on residents’ living standards? It combines that migration change with investor incentives, serviced land, construction reform and AI adoption.
Start with what we can measure.
Net overseas migration accounted for approximately 74.4% of the annual population increase; natural increase contributed about 25.6%. Migration is therefore relevant to demand, but a share of population growth is not a share of responsibility for housing prices. [1] The CPI figure describes economy-wide consumer inflation, not house-price growth. [2]
Where population growth came from
The housing council’s 2026 report examines both supply and demand. Its August update reports construction costs 51% above pre-pandemic levels, illustrating why releasing land alone does not deliver finished homes. [3] [4] The Productivity Commission identifies a long decline in housing construction productivity, giving supply reform an independent rationale even if migration slows. [5]
100,000 people. Thirty years. Six policy choices.
“New Australia” starts in 2026 with 100,000 residents and approximately 41,300 dwellings. Those are scenario inputs, not a measured Australian town. The initial ratio is about 2.42 residents per dwelling; it is not an occupancy rate because vacant homes and household composition also matter.
People & work
- Pause general immigration initially; retain a limited essential-worker route after local recruitment, training and automation.
- Allow renewals while skills remain necessary, without an automatic permanent-residency or citizenship pathway.
- Let AI and robotics change labour requirements gradually, rather than assuming instant replacement.
Homes & investment
- Offer temporary incentives for owners to sell additional investment homes.
- Release serviced land and fund infrastructure with published costs and milestones.
- Make construction responsive to households’ needs, subject to real capacity and financing constraints.
These are the proposal’s assumptions, not current policy recommendations endorsed by this analysis. Fertility varies across four paths: 1.5, 2.1, 2.7 and 3.5 births per woman. A fertility rate of 2.1 is conventionally described as around replacement level, but does not mean an ageing population instantly stops changing.
Better numbers—under a different set of rules.
House price / annual wage
One worker’s annual wage. Lower is better; this is not the usual household-income measure.
Household homeownership
Share reported in the draft. Higher is better for its stated ownership objective.
| Scenario | Births per woman | Population | Homeownership | Price / wage |
|---|---|---|---|---|
| Low fertility | 1.5 | 108,475 | 70.4% | 6.28× |
| Replacement-level fertility | 2.1 | 113,103 | 70.1% | 6.38× |
| Higher fertility | 2.7 | 117,782 | 69.8% | 6.49× |
| Large-family scenario | 3.5 | 123,933 | 69.4% | 6.62× |
| Draft baseline | Not supplied | 141,778 | 53.0% | 10.49× |
At 2.1 births per woman, the draft reports a price-to-wage ratio of 6.38× versus 10.49× in its baseline: a 39.2% lower ratio. Homeownership is 17.1 percentage points higher, at 70.1% rather than 53.0%. These are differences between two bundled scenarios, not estimated effects of migration policy alone. A lower ratio also does not necessarily mean nominal house prices fell: wages can rise.
Across the reform rows, population grows by 8.5% to 23.9% from the initial 100,000. The town therefore is not a strict zero-migration example: the proposal still permits essential workers. Natural increase, the initial age structure and residual migration cannot be disentangled from the supplied endpoints. Higher fertility also slightly worsens the reported housing ratio, from 6.28× to 6.62×.
Housing is a system, not a single lever.
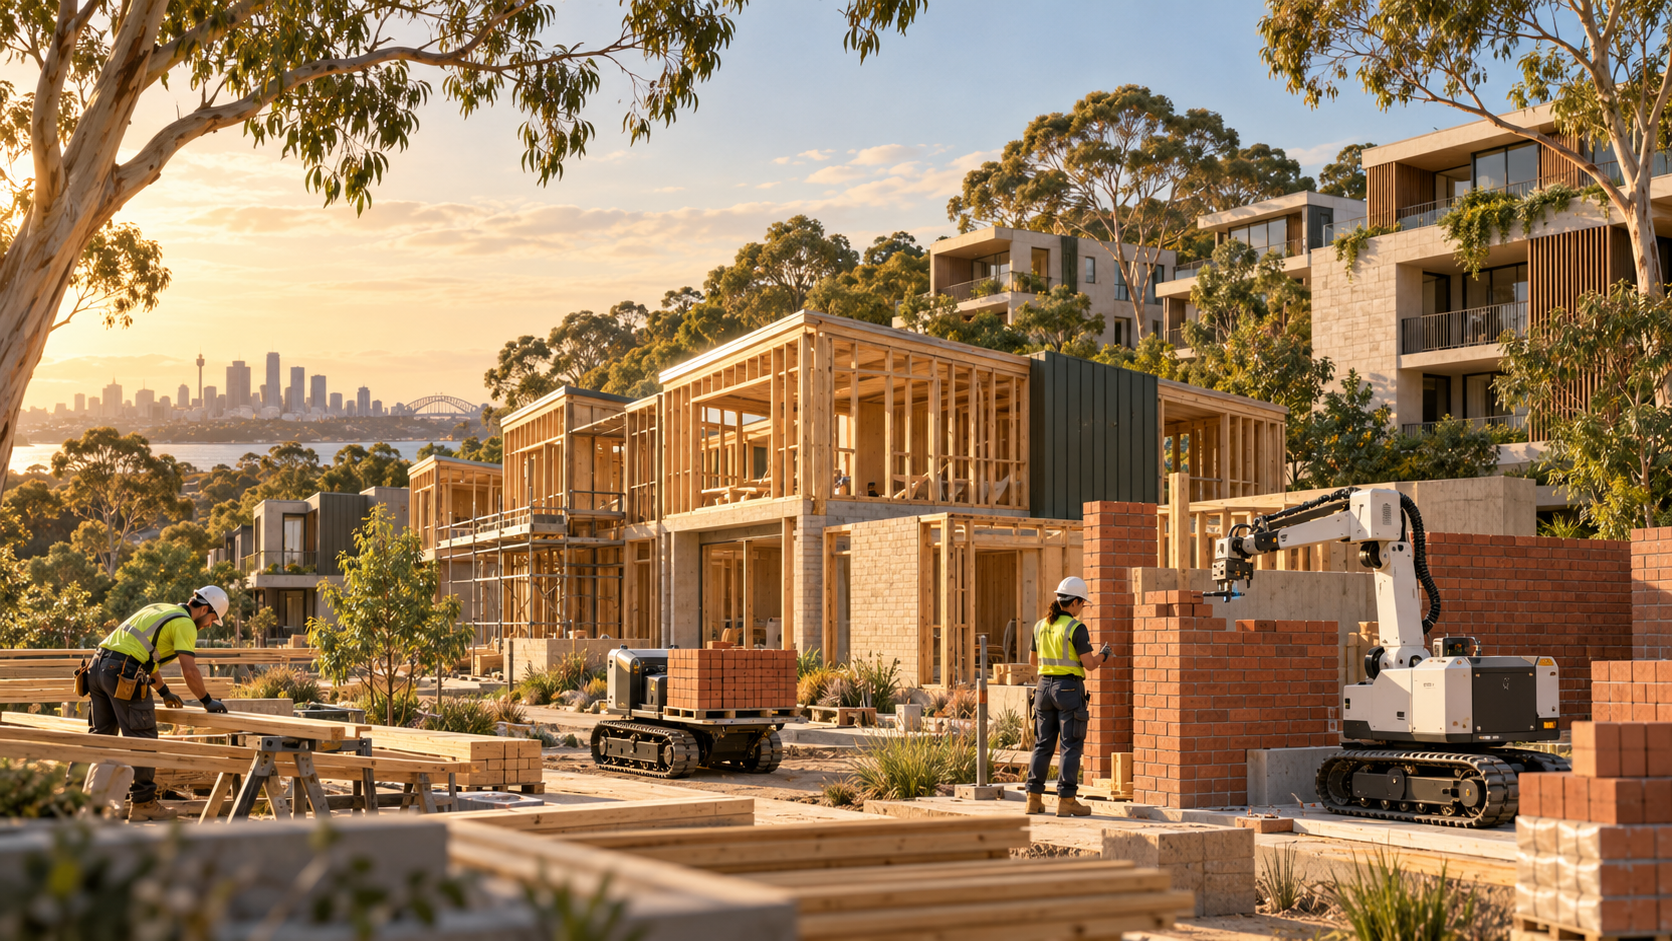
Migration affects demand—and the capacity to build
Fewer new residents can reduce near-term demand, especially in rental markets where supply cannot adjust quickly. The RBA describes that short-run mechanism in its discussion of international students. [6] But migrants can also work in construction, health and education. A credible policy comparison must account for both sides, by occupation and location, rather than subtracting people from demand while leaving supply capacity unchanged.
Selling an investment home does not create a new dwelling
A renter who buys a former rental home changes tenure, not the physical housing stock. If that household leaves a different rental property, the vacancy chain matters. If an existing owner buys it, rental supply may shrink without creating a new owner household. Incentives therefore need eligibility rules, a measured fiscal cost and protection for tenants who cannot buy.
AI is a productivity possibility, not a workforce forecast
Construction includes design, approvals, groundworks, installation, inspection and site-specific coordination. Automating one task does not automate the entire home. AI may complement workers, lower some costs or create new demand. The draft supplies no occupation-level adoption estimates, displacement costs or distribution of productivity gains. Test slow adoption and stalled adoption as well as rapid gains.
More births cannot immediately replace retiring workers
Children need housing, schools and healthcare long before they enter the workforce. Higher fertility can increase dependency costs in the transition. Whether housing security changes family size—and by how much—needs evidence rather than assumption. Education, childcare, preferences and health also influence fertility.
Temporary workers need a credible reason to come and stay
A pathway that rules out permanent settlement may make recruitment and retention harder for some essential professionals. The scenario needs to test vacancies, turnover, family arrangements and training costs. Citizenship status by itself does not measure a person’s contribution to housing supply or public services.
Budget discipline must preserve useful investment
Publish project business cases, delivery milestones and explanations for overruns. But distinguish avoidable waste from infrastructure that enables housing and productivity. Tax concessions have opportunity costs. The draft does not estimate net government revenue, service expenditure or how the Reserve Bank would respond; it cannot claim that spending oversight removes the need for monetary policy.
How many additional homes would growth require?
This simple calculator makes one relationship transparent. It divides an assumed population increase by an assumed average household size. It is an arithmetic illustration, not a demand forecast or the original simulation.
Required occupied homes = additional residents ÷ people per household, rounded up. Excludes vacancies, demolitions, existing shortages and changes among existing households.
Five goals. More than one success test.
| Goal | Measure to publish | Draft evidence |
|---|---|---|
| Ownership | Ownership by age and income; mortgage arrears | Aggregate scenario rate only |
| Affordability | Rent and mortgage costs / disposable income | Price / one wage only |
| Quality of life | Housing security, crowding, commute and services | Not measured |
| Population resilience | Age structure, dependency and essential vacancies | Population endpoints only here |
| Disposable income | After-tax income less housing and essential costs | Not measured |
Homeownership is valuable to many households, but secure, affordable renting also matters. A policy that helps buyers while displacing low-income tenants may improve one headline and worsen another. Publish results by age, income, tenure and region, including people who do not benefit.
What we know. What still needs testing.
This special reviews the supplied NewNWS draft and official sources available on 30 October 2026. Observed statistics, proposal assumptions, supplied simulation outputs and new arithmetic illustrations are identified separately. The charts render the same five endpoint rows as the table; they do not imply a trajectory between 2026 and 2056.
The draft describes 13 scenarios and five-year checkpoints, but the shared page’s download control did not expose a retrievable dataset. Its underlying equations, starting age distribution, baseline fertility, wage definition, price formation, construction response, migration totals and uncertainty ranges therefore remain unverified. Precision in the table should not be mistaken for confidence in a forecast.
A stronger next version would publish
- Model code, initial conditions, annual inputs, units and a versioned data dictionary.
- A common baseline with one policy changed at a time, plus combined-policy comparisons.
- Age-specific births, deaths and migration; household formation and regional labour needs.
- Construction delays, financing, vacancies, demolitions, rental transitions and infrastructure costs.
- After-tax household budgets, government accounts and slow-AI stress tests with uncertainty ranges.
A proposal worth testing. An outcome not yet proved.
The draft puts a useful question at the centre of economic policy: are growth and investment improving everyday life? Its combined reforms produce more favourable housing outcomes inside its own assumptions. That is a reason to investigate those assumptions, not evidence that Australia would follow the same path.
A practical housing programme must join demand planning to construction capacity, infrastructure, secure renting and workforce development. Migration settings can be part of that programme. Their success should be judged by evidence about homes and living standards, independently of race or ethnicity.
The goal is not simply a more valuable housing market. It is a country where people can afford to build their lives.
Follow the evidence.
- ABS population, March 2026 ↗
- ABS CPI, September 2026 ↗
- NHSAC: State of the Housing System 2026 ↗
- NHSAC: August 2026 update ↗
- Productivity Commission: housing construction ↗
- RBA: international students and the economy ↗
- Original NewNWS case-study draft ↗
Editorial note: This is an opinion-led policy case study with an evidence review, not a validated economic forecast. Illustrations were created with ImageGen. Source dates and measurement periods appear beside the data.